SpeculatorSeth Elite Indicator Suite Detailed Documentation
Advanced Cumulative Delta
Cumulative delta shows all market buy orders minus all market sell orders. However, there are some situations where it is more difficult to categorize an order as buy or sell such as in stocks with wide spreads. This advanced cumulative delta enhances the categorization algorithm by looking for the corresponding changes in liquidity. This is usually not necessary with futures, but can be useful if watching order flow for stocks.
Settings:
- LookbackMillis: Sets the lookback window to search for the liquidity change. Recommended setting of 5000 is able to match most orders.
- Reset On Session: Reset inventory at the start of every session.
Plots:
- CumDelta: Market buy orders minus market sell orders.
- Unmatched: Unfortunately even with the enhancements some orders cannot be categorized. This unmatched plot shows volume that was uncategorized and therefore not included in the cumulative delta calcualtion.
Alice
Alice is based on models taken from Albert Kyle's 1985 paper "Continuous Auctions and Insider Trading". For a given period and target price change the indicator calculates a theoretical optimal contract size. In other words it is a measure of how much volume the market can handle at that time. In reality the maximum size you could trade will be much smaller than what the indicator shows. Use as a filter to determine when there is enough activity to trade.
Settings:
- Period: Number of bars you expect to be in a trade.
- Target: Change in points expected for a given trade.
Data Pipe
Data Pipe exports all data recieved for the instrument/chart that the indicator is added to. The data is written to a csv file under NinjaTrader's saved folder. This can be useful if you want to export the data for analysis later in other programs. IE if you wanted to process the data in Python. Caution! this indicator generates large amounts of data that is saved to disk. Even a few hours worth of data can be several gigabytes. That is why the indicator includes options to limit the time frame data is collected from. It is recommended that you have a large disk for permanent storage, and that you do not have your NinjaTrader documents folder in Microsoft OneDrive.
Settings:
- Start Hour: The hour in local time that you would like to start exporting data.
- Start Minute: The minute in local time that you would like to start exporting data.
- End Hour: The hour in local time that you would like to stop exporting data.
- End Minute: The minute in local time that you would like to stop exporting data.
- Export Market Depth Events: Whether or not to export events relating to market depth. Market Depth events happen frequently so turning this off can save a lot of space.
- Export Market Data Events: Whether or not to export events relating to market data. Market data events essentially have information about executed market volume.
Inventory Cost Basis
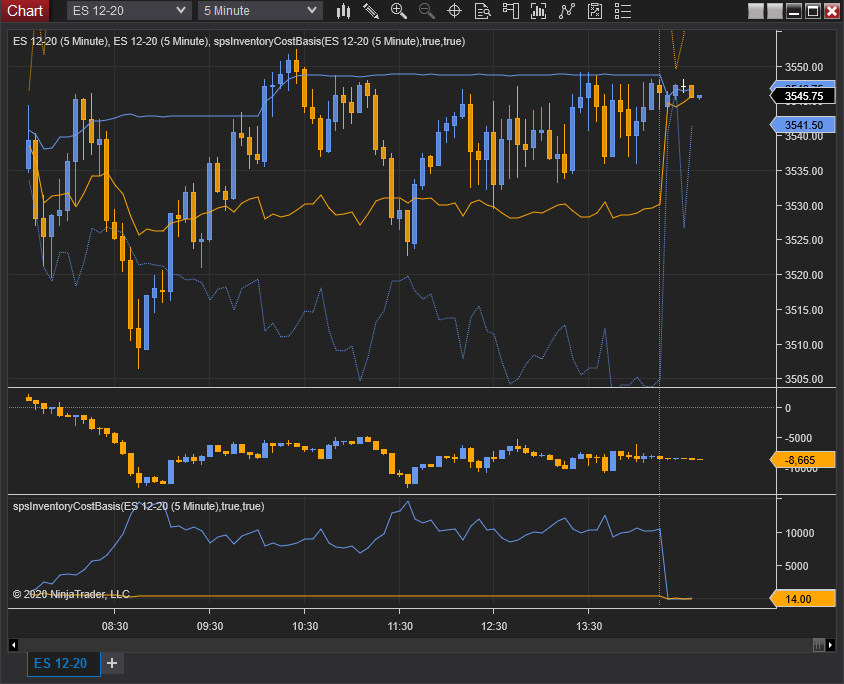
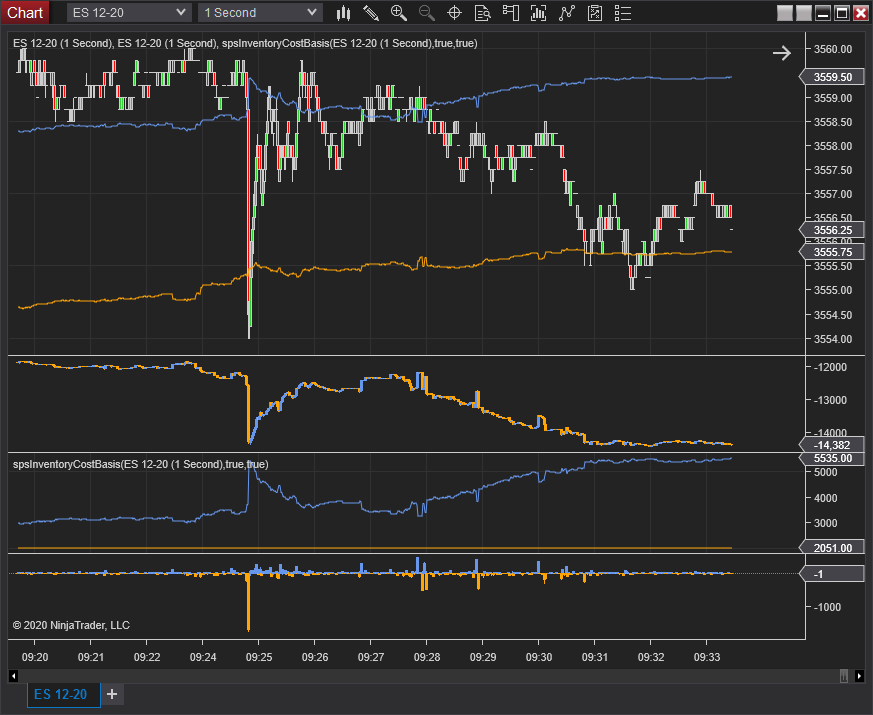
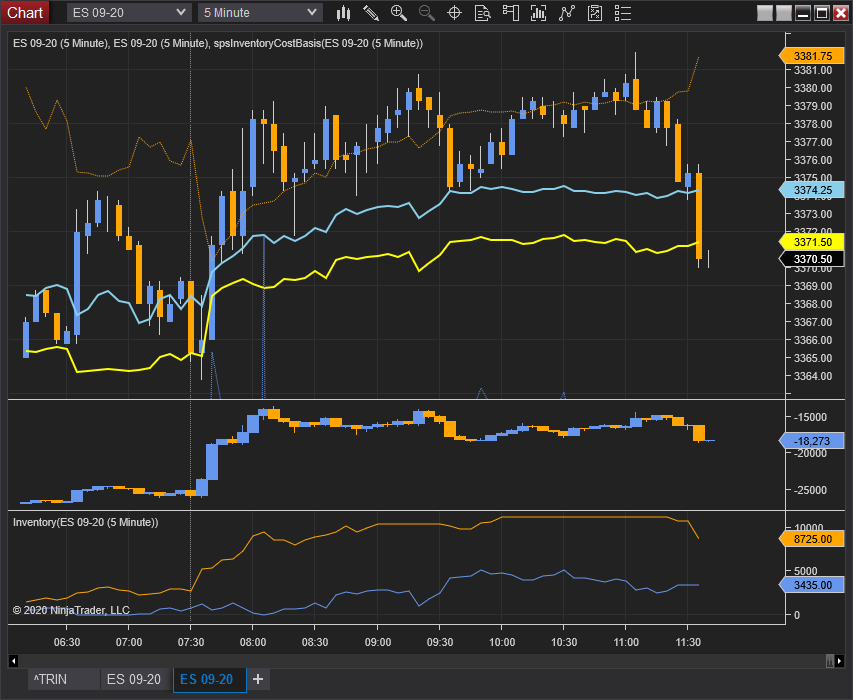
The Inventory Cost Basis attempts to model market maker behavior. Such market making strategies are placing limit orders at multiple prices to make money on the spread, and must manage an inventory. When an order adds to a position it is adding to the market maker's inventory. Similarly when an order is taking profits it reduces the outstanding inventory. The average price at which the currently outstanding inventory has been aquired is called the cost basis. The Inventory Cost Basis indicator uses rules to model when market makers add to or take profits on their positions. From this we can estimate the overall market's cost basis for both buy and sell side inventory. We can also look at how much profit has been built up over the day vs how much inventory is currently outstanding to calculate an estimated break even line for the day.
Plots:
- Cost Basis: The estimated average price that current inventory has been aquired at.
- Stopout: The point at which market makers start losing money based on how much profit has been built up, and how much inventory is being held.
- Inventory: The number of contracts currently being held in open positions.
- Profits: How much profit has been built up from reducing inventory at a price better than where the inventory was aquired.
- Risk: How much money is being risked by current inventory. Essentially profits divided by inventory.
Settings:
- Cumulative: If true the indicator calculates over the entire chart. If false the metrics are on a per bar basis.
- Reset On Session: Reset inventory at the start of every session?
Patterns
- Range bound action: During range bound or extremely slow action is common for price to bounce between the buyer and seller cost basis.
- Near bounce: On days where price is clearly controlled by one side it is common to see profits taken as price comes back to the near side cost basis only to see price bounce as the controlling side adds again.
- Far bounce: Price can also come back to the far side cost basis and bounce. Losers reducing inventory at their own cost basis might be a factor in such bounces.
- Stopout: When price reaches the stopout line it is common to see stop runs far beyond the line. Expect to see fast moves, reduced liquidity, and erratic movement beyond the stopout line. Price almost always comes back after extending through the stopout line, but caution is advised. There is no telling how far it will go before coming back to balance. If new money is coming into the market there's no telling far far it can go.
Limitations: The model does not take into account when market makers might be dumping contracts at a loss. The indicator is better at showing what market makers are doing, but they are not the only participants in the market. Therefore when informed traders are pushing price against market makers the indicator is less useful.
Examples:
Kalman Filter
A filtering method used in statistics to filter out statistical noise. Famous for its use in radar systems. Works ok as a moving average, but shines as a way to filter noise in more sophisticated models.
Settings:
- Gain: The weight given to the measurements and current-state estimate.
Largest Resting Orders
Largest resting orders looks at individual changes in the level2 and tracks the size of the largest single change. This can help identify the presence of large institutional activity. The default values of 0 mean no filtering is done on these properties.
Settings:
- Min/Max Filter: Limits the size of orders shown. This is not particularly useful on this indicator, but is available on all of the level 2 histogram indicators.
- Min/Max Position Filter: Limits updates by how many levels away the change is occuring. Many large order changes occur at prices extremely far away. This filter allows you to focus on them or filter them out. The default value of zero means no filtering.
- Show Bids/Offers: Filters for showing only bids or offers are useful for determining where the large orders are more active. Try adding the indicator twice with one showing only bids, and one showing only offers.
Limitations: Large players can split their orders up into smaller blocks making them harder to detect. Large orders particularly if they are not close to current price are probably meant to be noticed.
Examples:
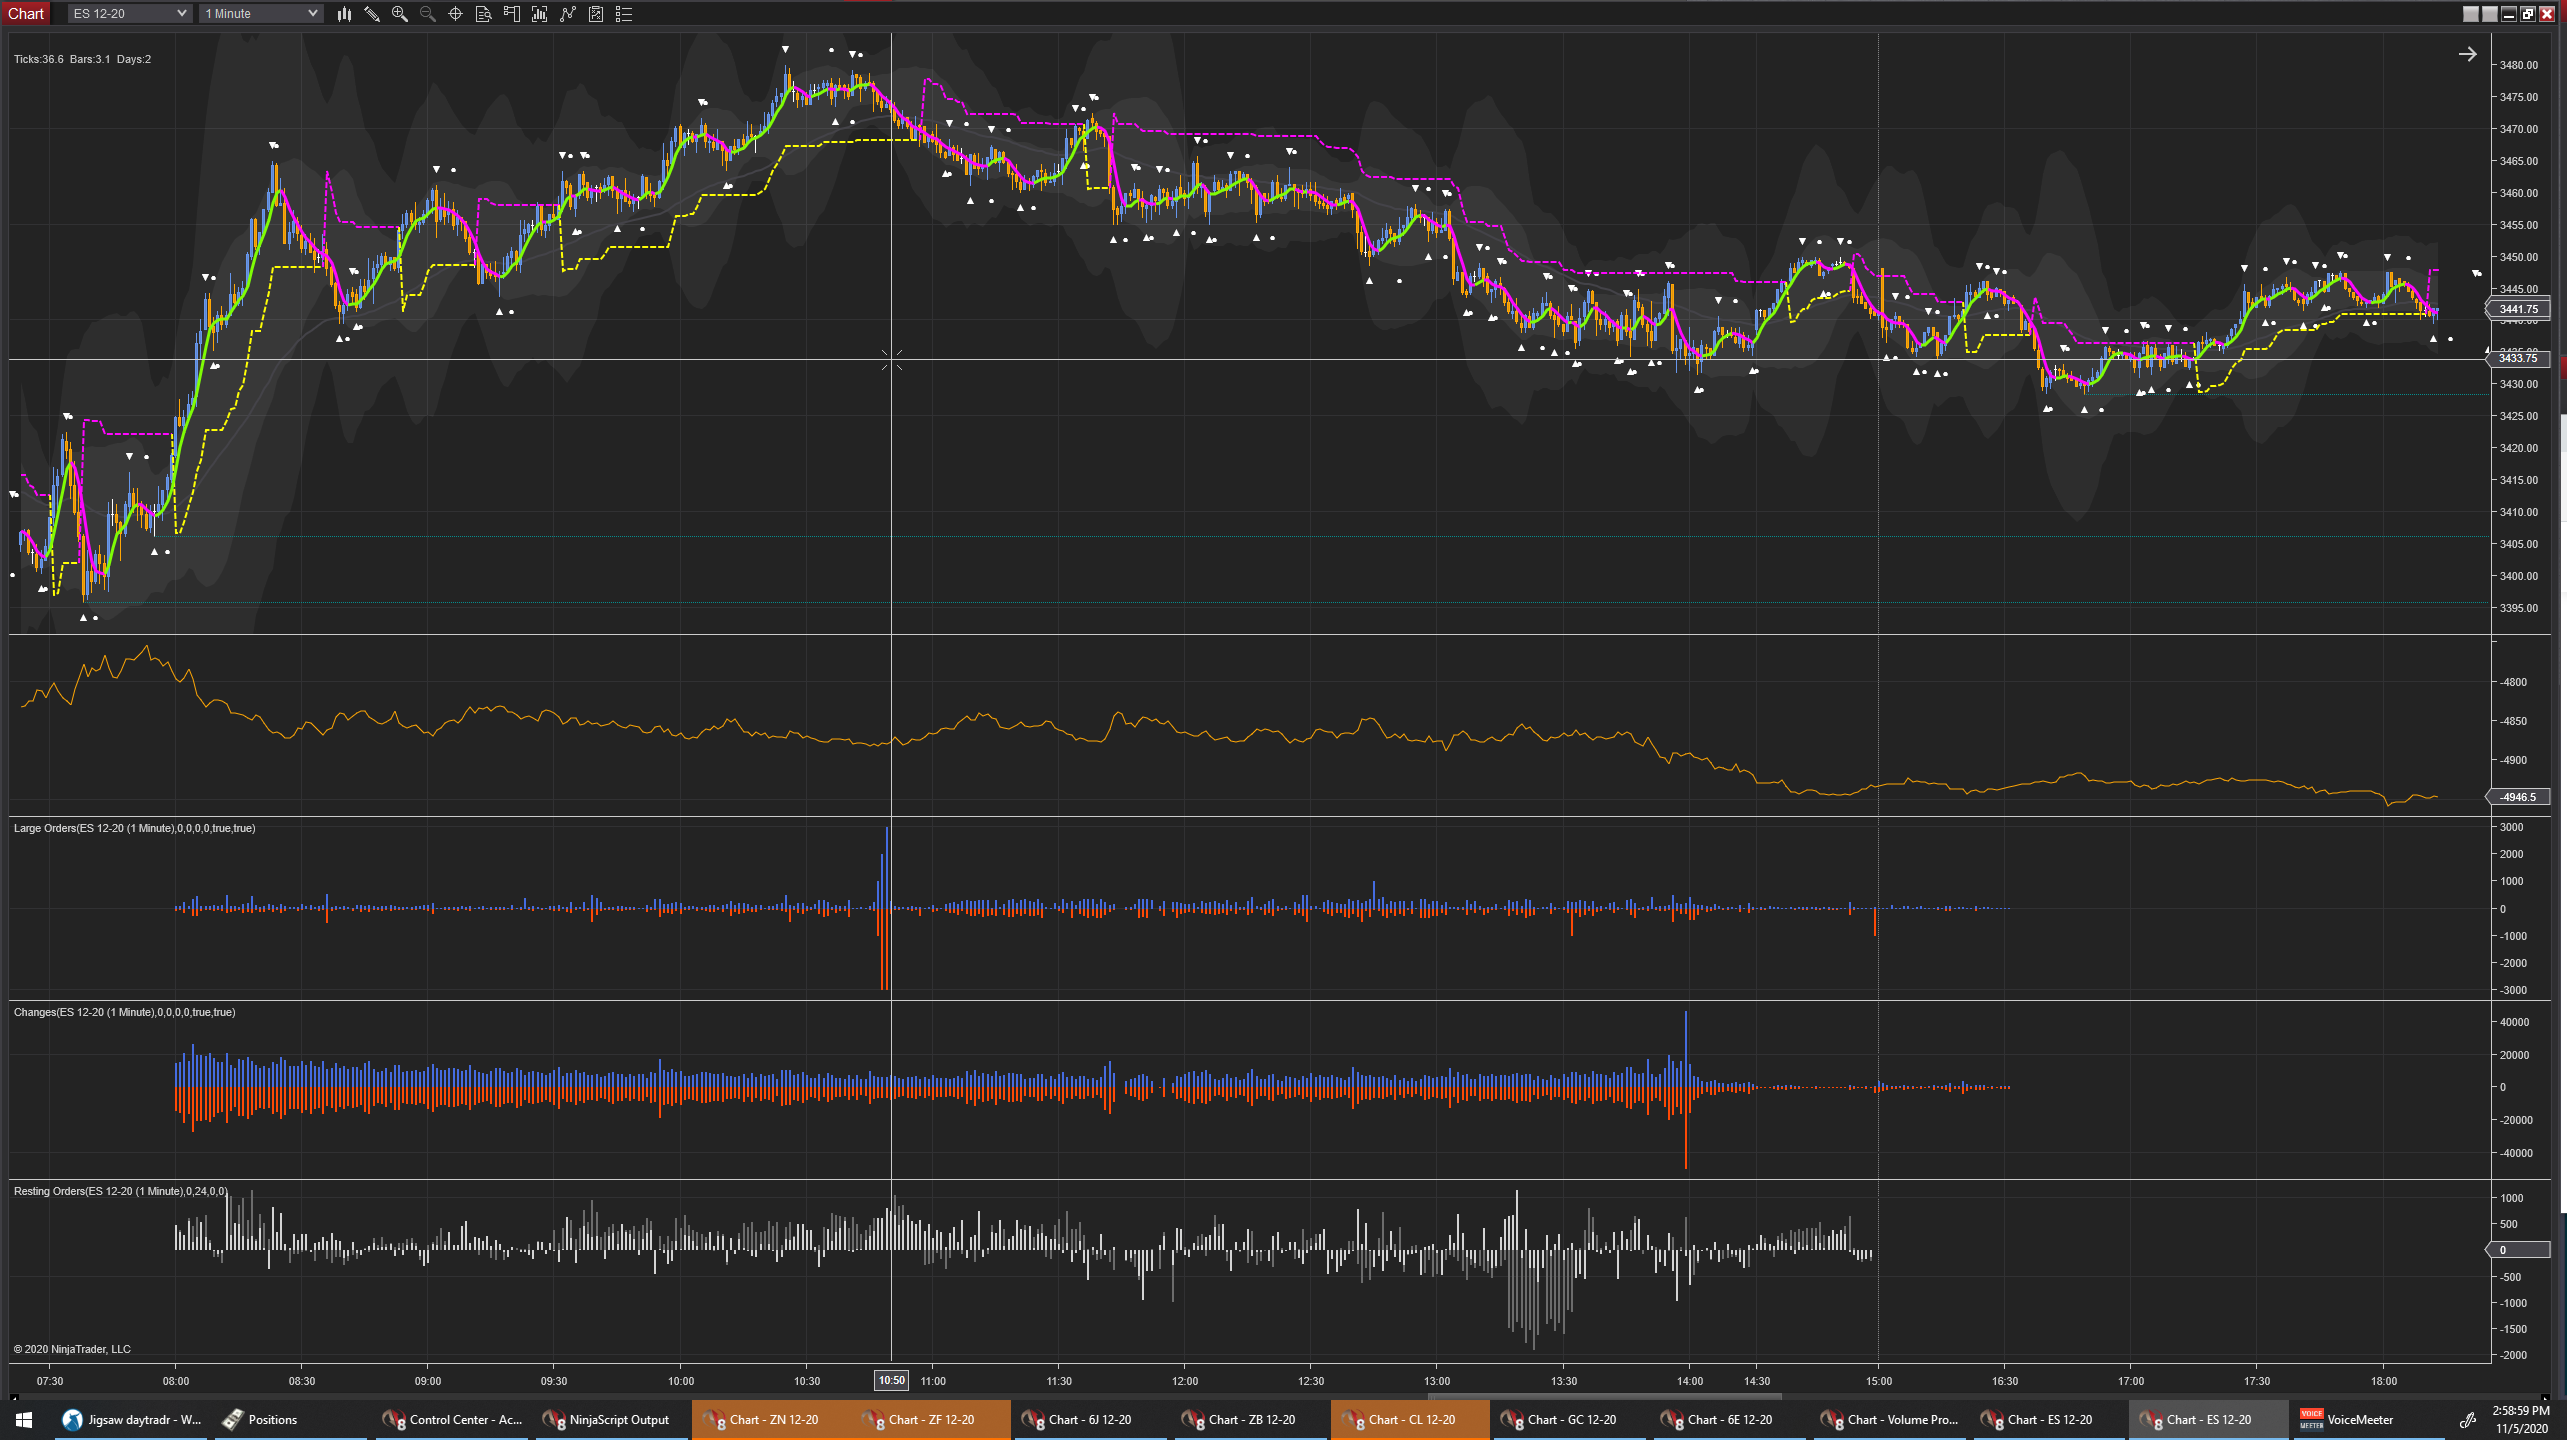
Level2 Changes
Level 2 Changes counts the total number of individual level 2 changes during the time period. Use is similar to volume. During high activity times the number of changes should be higher. Filters can also be used to judge activity levels of different types of players. .
Settings:
- Min/Max Filter: Limits the size of orders shown. For instance, you only want to see how many changes are being made by large orders, or by 1 lot orders.
- Min/Max Position Filter: Limits updates by how many levels away the change is occuring. Many large order changes occur at prices extremely far away. This filter allows you to focus on them or filter them out. The default value of zero means no filtering.
- Show Bids/Offers: Filters for showing only bids or offers. Try adding the indicator twice with one showing only bids, and one showing only offers.
Limitations: Automated systems can place and modify lots of orders quickly to artifically show activity. Such spoofing can itself be a signal.
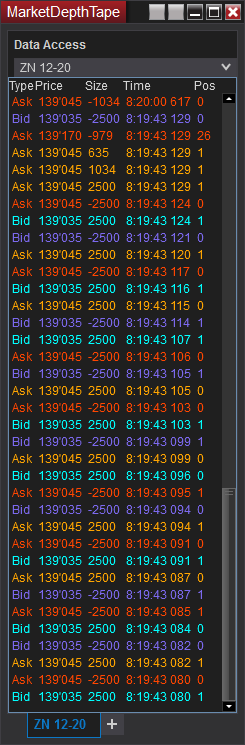
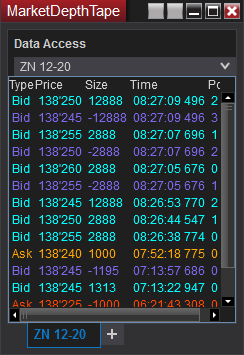
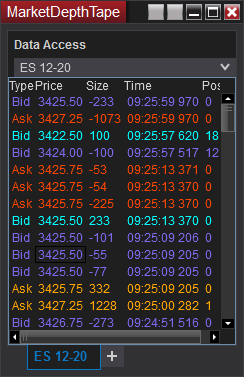
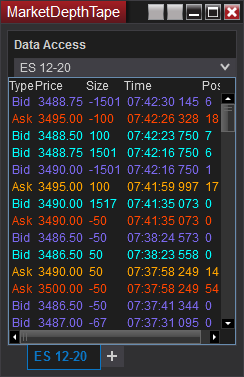
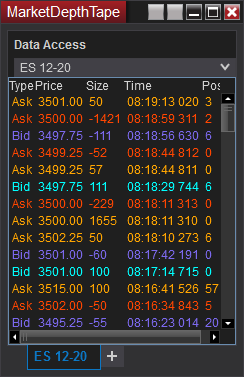
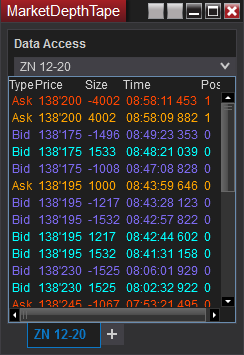
Level2 Tape
Similar to a traditional tape, but showing activity from limit orders. Particularly useful to detect significant changes in level2 created by large limit orders moving around. Includes filtering options and notifications options. This component is installed as an addon. The component will show up at the bottom of the "New" menu in NinjaTrader 8's control center.
Settings:
- AskPullColor: Color used for when an ask is pulled meaning that the ask at that price decreased.
- AskStackColor: Color used for when an ask is stacked meaning that the ask at that price increased.
- AskPullColor: Color used for when an bid is pulled meaning that the bid at that price decreased.
- AskStackColor: Color used for when an bid is stacked meaning that the bid at that price increased.
- Min/Max Size Filter: Limits what orders will be shown by size. It is recommended to set min size to a large order size that is not common.
- Min/Max Position Filter: Limits updates by how many levels away the change is occuring. Many large order changes occur at prices extremely far away. This filter allows you to focus on them or filter them out.
- Show Bids/Offers: Filters for showing only bids or offers. Might be useful if you want a different sound for bids vs asks.
- AudioFileLocation: Name of a wav file to play every time a new update is shown. The file must be located within your base NinjaTrader8 folder. Usually this is /users/{username}/Documents/NinjaTrader8/
- You can download the chirp sound that I use here.
Examples:
Market Orders Imbalance
Shows buy/sell imbalance of market orders over a rolling window. A value of 1 meaning all orders were buy orders, and a value of 0 meaning all orders were sell orders. Extremes in value often accompanies short term changes in direction. Try using in automated strategies.
Settings:
- Period: Length in bars of the rolling window.
Multi ATR
Combines Range and ATR into a single chart, and allows you to change the underlying unit for the calculations. Try using it on a daily chart to measure daily volatility.
Settings:
- Range Type: Switches between measuring range in points, ticks, or percent.
- Period: Period used by ATR.
Pulled Prices
Identifies locations where liquidity pulled completely resulting in prices where no volume traded. Such impulsive moves are more likely to become liquidity holes that will be visited over and over again.
Settings:
- Allowed Volume: If true the indicator calculates over the entire chart. If false the metrics are on a per bar basis.
- Minimum Gap Size: Reset inventory at the start of every session?
- Rising Sound File: Plays this .wav file when a rising gap is detected. File must be under base Documents/NinjaTrader 8 folder.
- Falling Sound File: Plays this .wav file when a rising gap is detected. File must be under base Documents/NinjaTrader 8 folder.
- Pulled Ask Color: Color of box drawn when a rising gap is detected.
- Pulled Bid Color: Color of the box drawn when a falling gap is detected.
Plots:
- Signal: Value is 1 if a rising gap was found that bar, and -1 if a falling gap was found. This allows the indicator to be used by algorithms to trigger entries.
Range Histogram
This indicator draws a distribution histogram of bar range in place of the standard indicator plot. Programmers can inherit from this indicator to plot histograms of their own.
Settings:
- UseLog: Many distributions have fat tails. By displaying values on a log scale it can be easier to fiew the distribution.
- UseArea: By default the value area is drawn to show a percentage of all samples with the mode in the center. With this option checked value area will be calculated from how much profit each bar represents. This helps account for fat tails when using the histogram to find profit and stop targets.
- Value Area Percent: Percentage to use in the value area display.
- LimitByDayOfWeek: If checked the stats will only be calculated for the day of the week specified. Try creating multiple charts limited by different days to compare the stats.
- Week: Limit stats to specified day of the week if LimitByDayOfWeek is true.
Resting Orders
Resting orders looks at the balance between the number of bids and number of asks currently placed on the DOM. Multiple data series are provided to help show the impact of stacking and pulling on the balance. Indicator can help indicate imbalanced pressure in the book, and can often indicate direction or presence of strong trend.
Plots:
- MaxDifference:MaxAsks - MaxBids as described below.
- MinDifference:MinAsks - MinBids as described below.
- Max Bids/Asks:All Bids/Asks at every price within the filters ranges added together. Max shows the highest this number became during the time period. This helps shows the impact of spoofing orders moving.
- Min Bids/Asks:All Bids/Asks at every price within the filters ranges added together. Min takes the minimum amount of liquidity seen at each price level during the time period. This helps shows orders that do not cancel and are more likely to want a fill.
- Min/Max Filter: Limits the size of orders shown. This is not particularly useful on this indicator, but is available on all of the level 1 histogram indicators.
- Min/Max Position Filter: Used to select which prices are included in the imbalance calculation. Since the inside bid/offer change a lot it is often helpful to exclude this by setting Min Position to 0.
Settings:
Limitations: Large players can split their orders up into smaller blocks making them harder to detect. Large orders particularly if they are not close to current price are probably meant to be noticed.
Spread & Spread Candles
Charts a spread between two or more instruments. Note that spread and spread candles have now been combined into one indicator. Common Spreads can be found on the CME Website
Settings:
- Number Of Legs: Increase beyond the default value of 2 to chart butterfly's or other more sophisticated spreads.
- LegX: Contract used for that leg of the spread. For instance the NOB spread is the 10 year note vs 30 year bond. The front leg of the NOB spread is "ZN".
- RatioX: Ratios are used to account for the ticksize difference between two contracts. The spread ratio for the NOB spread is "5:2", and therefore the front ratio is "5". In a typical 2 leg spread the second ratio will have a negative value ie -2 for NOB.
- User Provides Month: Default off setting uses the main chart's expiration month to find the correct contract for the spreads. This helps the spreads roll over automatically when the main chart rolls over. If this is on then the month can be specified by the user in the Front Leg and Back Leg parameters such as "ZN 12-20". This allows you to show seasonal spreads. Note though that you'll need to modify the FrontLeg and BackLegs manually when the contracts roll over.
- Chart Type: Switch between a simple line on close chart, or a candlestick chart.
- Gray Historical Bars: For candlestick spread charts the high and low of a bar will not always be accurate for historical data. With this option checked historical bars are grayed out.
Synthetic Dollar Index
Calculates the value of the dollar index synthetically by using spot data from CME FX Futures instruments. The dollar index provides an easy way to see how the value of the dollar is changing, and adjust your trading in other instruments accordingly.
Volatility Projected Range
Estimates daily targets from the open based on the provided volatility index (usually the default VIX). The indicator will draw a 50% and 100% target above and below the open. On an average day it is typical to reach the 50% target. On a strong or trending day we tend to hit the 100% target. It is common to see a lot of activity and stopout activity when price reaches these levels. These levels make excellent price targets. Note: Not all data subscriptions provide VIX data.
Settings:
- Volatility Index: Selects the Index that the indicator uses. By default this is set to ^VIX, but could be switched to other indexes to use on instruments other than equity indexes.
- Factor Sets factor applied to the volatility index. The expected percentage move for the day is equal to the volatility index / Factor.
Yield Curve
Displays a plot of the current yield curve. Intended to be used on a daily chart. Clicking on a day will draw a second curve so you can compare the change in the curve between periods. Note this indicator uses Micro Yield Futures data, and cannot show data for periods before the Micro Yields went live in 2021.